
Blog post
UNDERSTANDING SCIENTIFIC INFORMATICS SUPPORT
First Rule of Customer Support: Be responsive.
Second Rule: Do not talk (much) to your customers!
Sounds ironic? Not actually. We’ve been preaching this rule to our scientific application support analysts and it’s starting to work wonders with our user experience. We are now supporting in excess of 25000 scientists/statisticians/analysts and over 110 applications across the spectrum of discovery, R&D and clinical studies, and this rule holds good for every request/issue we resolve. Every contact we have with a customer influences whether or not they’ll come back. We have to be great every time or we’ll lose them. – Kevin Stirtz, marketing expert and author. But how?
RUNNING A COUNTERINTUITIVE EXPERIMENT
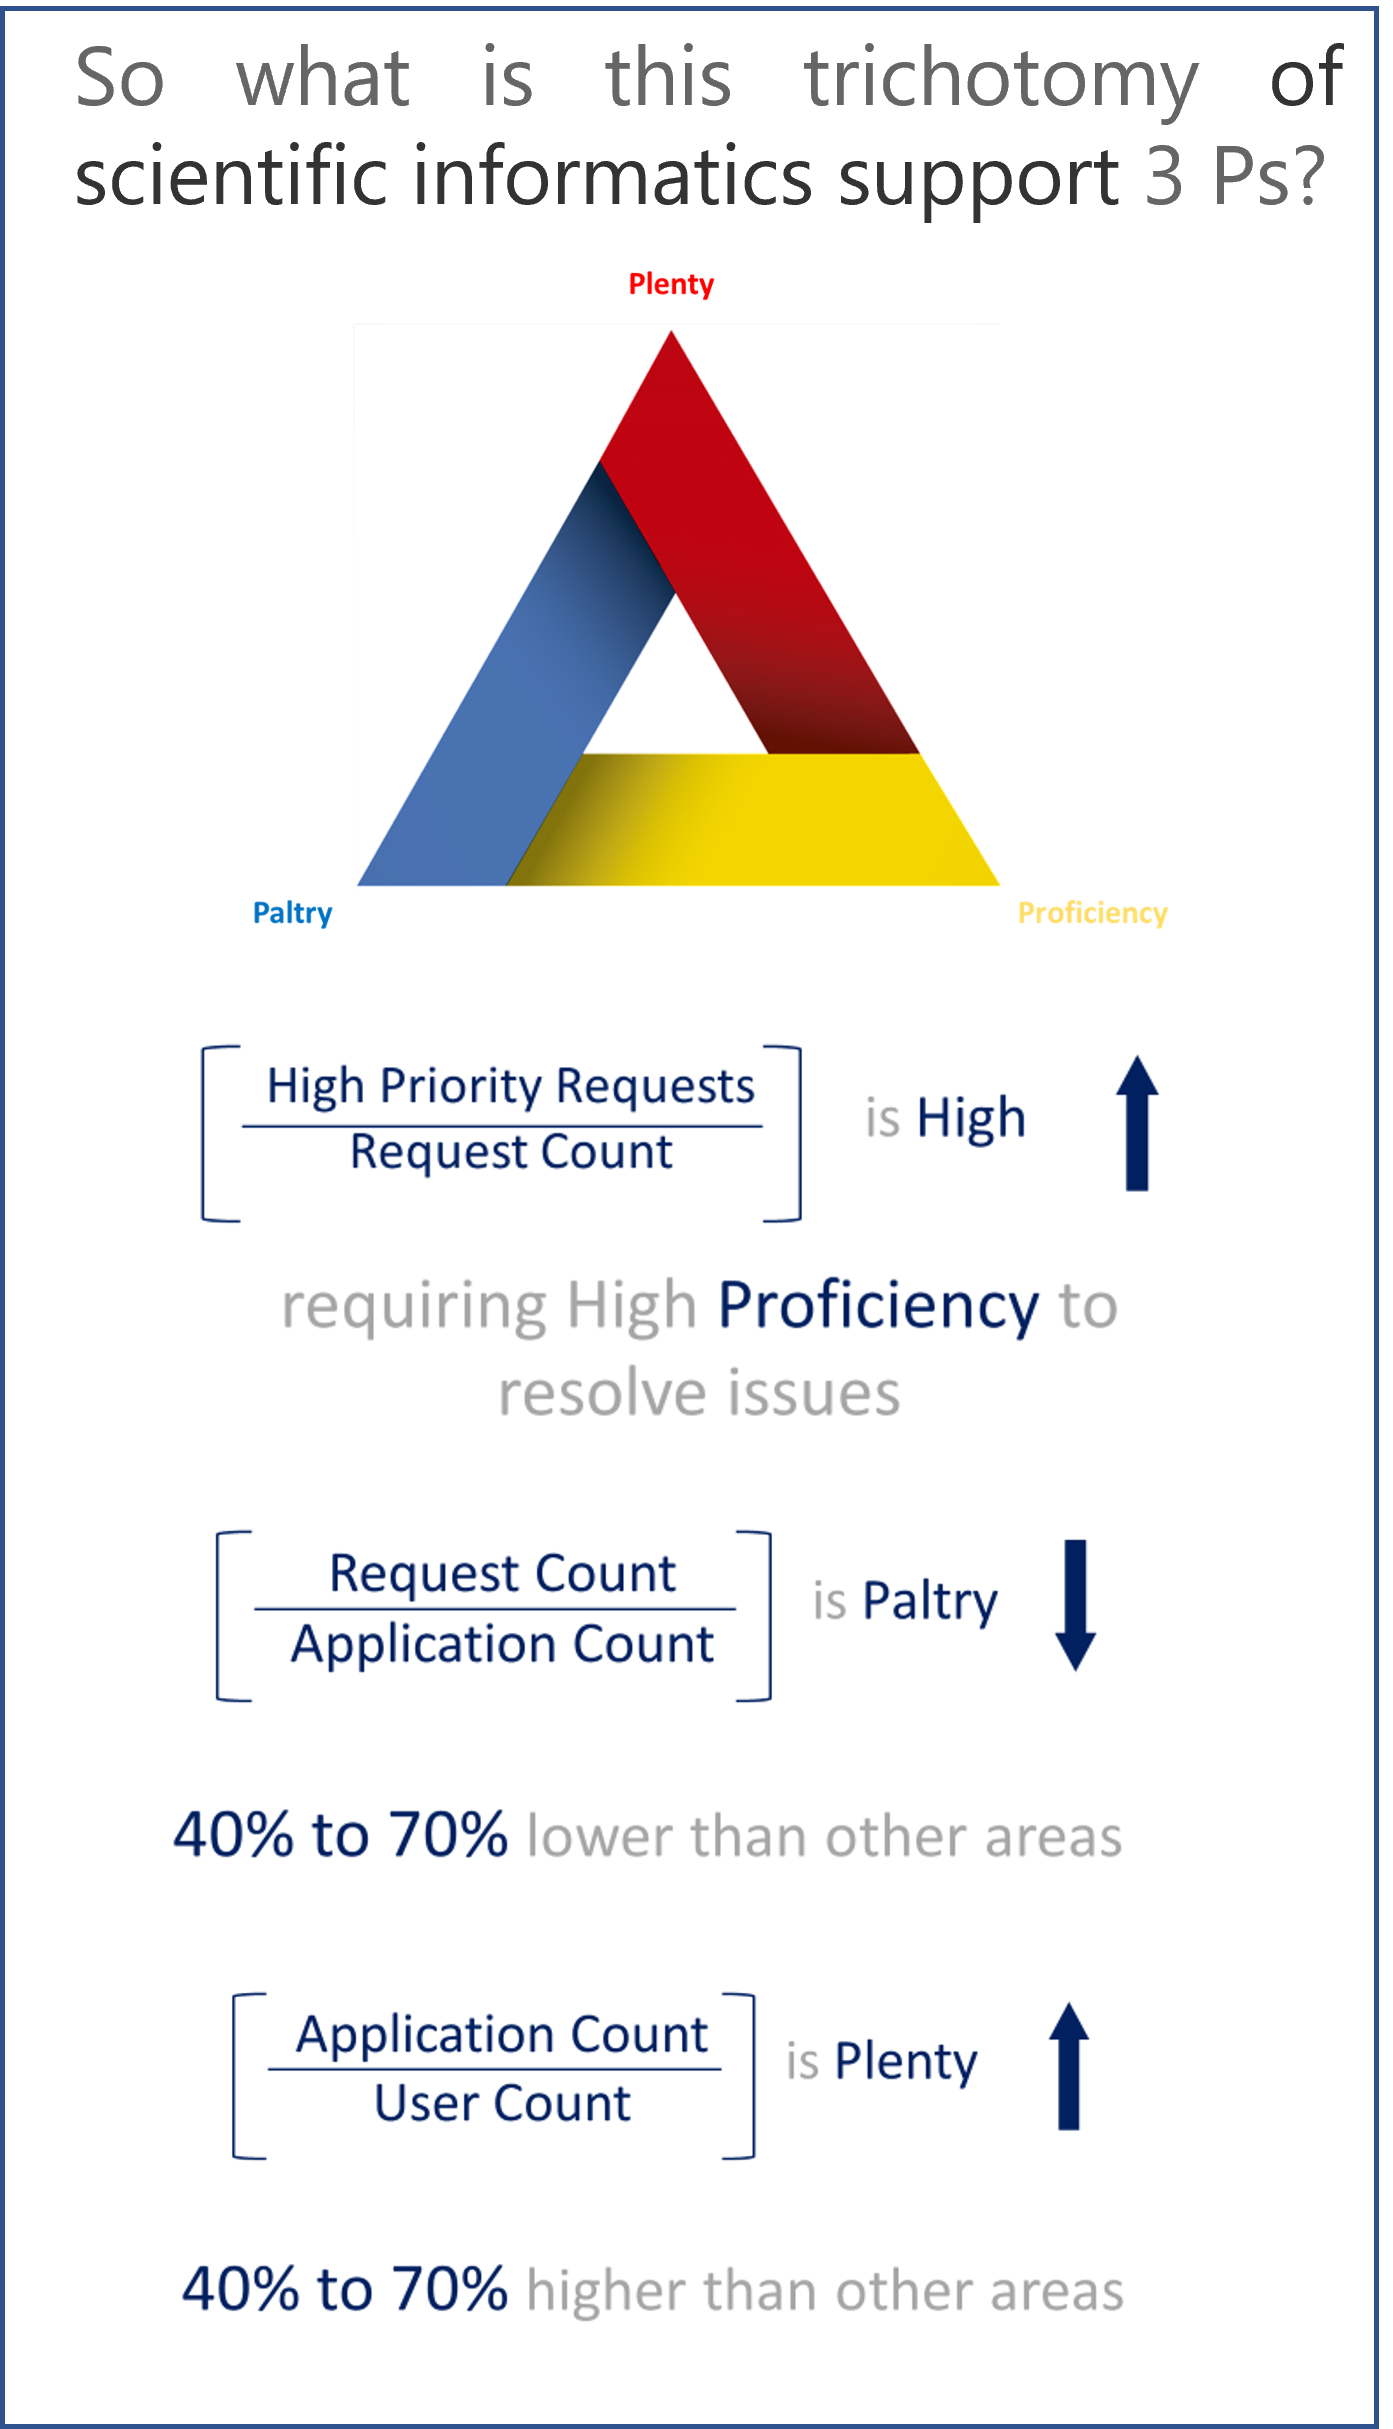
We’ve come to realise that scientific application support is characterized by 3 distinct attributes. We fondly call it the trichotomy of the 3 Ps.
Navigating this landscape isn’t a walk in the park. Our service delivery methodology has been fine-tuned constantly to tame this trichotomy, keeping in mind the diverse aspects involved. It required a multi-faceted approach that includes creating/adopting new technologies, adding to our scientific repertoire, redesigning our processes with a user-centric design and maintaining the security robustness of the scientific applications.
The obvious focus in any application support is to measure and meliorate User Experience. Following this, we started with the traditional approach of obtaining periodic feedback from users, developing a standardized form that compiles 14 key aspects of any project, and an overall score. Listening to scientists and other end-users from across the globe over a period of 4 years, we gathered a lot of information, emotions, appreciations and concerns.
This allowed us to read between the customer’s responses and gain insights into their experience and the quality of our support.
Beyond the 14 points standardized for any project model, we decided to take things up a notch to see how we can put the customer-centric approach to scientific application support so that at every opportunity, we give them more than what they expect.
And, based on the data we gleaned from our feedback score, we were able to arrive at a fascinating metric that influences a user’s support experience:
Number of Interactions
Identifying this metric made us realise that we need to look beyond the measurable data that we had in terms of feedback scores and delve deeper into a user’s interaction with our teams and how it influences their experience.
We decided to conduct a Social Experiment with our Scientific Support Analysts with the intention of tracking the number of iterations a user goes through before their issue is resolved by our team.
Consciously measuring the number of iterations led to two improvements.
The first was foreseen – The less time users spent talking about their issues, the happier they were at the time of resolution.
The unexpected improvement was that our analysts were striving to keep the number of iterations down, and this led to a more science-driven and focused approach to delivering scientific application support seamlessly.
Analysts spent more time per request on examining the situation clinically, empathizing with the scientist or end-user. Our scientific background allowed us to speak the user’s language and to analyse the request comprehensively before reaching out to the user for inputs.
KEY TAKEAWAYS
The satisfaction of scientific curiosity that comes when an experiment results in an insight is only matched by the eagerness to move to the next experiment. We have a few more experiments lined up for our analysts and would love to share them, but those are for another day!
P.S: Still curious? Think Natural Language Processing… 😉